

Microplastics quantification and characterisation
Microplastic characterisation is usually conducted at three levels (Figure 4), all of which provide key defining information on the microplastic. If the sample contains larger meso and macro plastics, these can often be readily identified visually without isolation, although polymer type still requires chemical confirmation. Similarly, if the experimental design requires that large microplastics (1 to 5 mm) are to be counted, as pieces are visible to the naked eye, the procedures applied at each level are less intensive – although the use of a binocular lens or similar is highly recommended. If small microplastics (1 µm to 1 mm) are also being quantified, a more thorough microscopic procedure is essential. The workflow for processing microplastic samples needs to be tailored to the research question, considering the nature of the sample at the time of collection (i.e., relatively clear vs organic rich), collection method, preservation method, available equipment, level of expertise and finally how the data is to be reported.

Figure 4. The three levels of microplastic characterisation and identification and the type of data produced. Figure adapted from Lynch et al 2023
Microplastics quantification
Visible microplastics (1 mm - 5 mm)
Quantifying visible microplastics does not necessarily require a microscope and they can often be counted using the naked eye, or weighed. Where further morphological information is required (i.e., texture, surface uniformity), a microscope is recommended. To count microplastics in the visible category the filter or sieve can be investigated by using the naked eye.
Microscopic microplastics (1 μm – 1 mm)
There are several ways to quantify microscopic microplastics (i.e., not discernible to the naked eye) once they have been isolated using methods described above (e.g., filter, sieve). Some approaches require manual counting under a microscope, while others rely on microphotography and specific software for semi-automated counting. Table 10 highlights a number of these methods and their advantages and limitations.
Table 10. Table of the different quantification methods for microplastics including their advantages and limitations.
| Microplastic quantification method | Advantages | Limitations |
|---|---|---|
| Manual counting methods | ||
| Gridded method | - Cost-effective - Straight-forward process |
- Time intensive - Requires experienced operators - Observer bias |
| Fluorescent dyes (e.g., Nile Red) | - Cost-effective - User friendly |
- Added processing steps and chemical considerations - Does not bind to all polymers - Dyes biological material (false positive) |
| Automated counting methods | ||
| Image analysis software (e.g., Image J, CellSense image analysis) | - Highly accurate - Saves time - Automated - Removes human error |
- Requires setup and calibration - Requires specific software - Requires high resolution microphotographs |
Gridded method
Under a microscope, the gridded method involves examining and counting the microplastics in each square of a real or virtual grid (Brandt et al., 2021). If the microplastics are too numerous a subset could be counted in each square of two diagonals throughout the filter (see Figure 5 below as an example). However, it should be noted that this latter method may not always be representative of the sample.

Figure 5. An example of the counting technique that could be used to quantify a subset of microplastics.
Fluorescent Dyes
Fluorescent dyes can be chosen based on their properties, including compatibility with the microplastics of interest, stability, and fluorescence characteristics. Nile Red is the most commonly used dye, however, Rhodamine B, Acridine Orange, Propidium Iodide and others can also be used. It is important to note that the choice of fluorescent dye depends on the research objectives, the specific polymers of interest, and the available instrumentation for detection. The dye is mixed with the environmental sample, processed following the post-survey procedures above, and examined using a fluorescence microscope. When illuminated with a specific wavelength of light (excitation wavelength), the fluorescent dye attached to the microplastics absorbs the light energy and re-emits it at a longer wavelength (emission wavelength), producing visible fluorescence, and highlighting the microplastics.
Image analysis software
Software such as ImageJ (Fiji), a free Java-based image processing program (U.S. NIH, MD, USA https://imagej.nih.gov/ij), CellSense, Saturna Imaging System (https://oceandiagnostics.com/microplastics-imaging-technology) and others enable semi-automated counting of microplastics. The data can be automatically exported from these software packages into a spreadsheet.
Once counted, the microplastics should be categorised primarily by type (fibre, fragment, film, foam, bead, etc) and colour, with other visual factors that support the identification of microplastics recorded, i.e., structure homogeneity, absence of cell structure or glossy surface (see Physical characterisation). All items categorised as putative microplastics should be chemically assessed to confirm their identity (see Chemical characterisation). If there are too many items, chemical assessment of a subset should be undertaken, documenting how the subset was selected and its representativeness determined. For microplastics treated with fluorescent dye, it is also important to identify the chemical signature of the dye, as this needs to be accounted for in later chemical analysis.
Physical characterisation
Accurate physical characterisation lies at the heart of understanding the nature and impact of microplastics in environmental samples. This section discusses the methodologies and considerations essential for characterising microplastic contamination based on their physical attributes. Plastic characterisation provides valuable insights into the size distributions, types, and other key physical properties of microplastic. Accurately reporting this information can allow researchers to further investigate the complexities of microplastic contamination and investigate trends. The methodologies outlined herein are designed to enhance the accuracy and consistency of microplastic analysis, contributing to a more comprehensive understanding of their presence and potential effects in various environmental matrices.
Reporting of microplastics physical data should be standardised by their size, type and colour. There are several pre-existing methods for reporting microplastic characteristics, therefore, to ensure comparability, particularly with long-standing datasets, it is recommended that photographs of the different types of microplastic, along with a scale bar, are included in reporting, e.g., as supplementary information in published material.
Physical properties
Reporting on the physical properties of microplastics is essential in the identification and confirmation of microplastics, while also providing important information on potential sources of contamination. However, care must be taken to avoid human error or bias when measuring the size, morphology, type, and colour of individual microplastics. Automated image analysis methods can be much faster and more reliable than human assessment, but require photographs/images taken under consistent lighting conditions at a known scale and of suitable resolution to ensure accurate and reproducible measurements of physical parameters. Automated image analysis requires plastics to be photographed on a background that is sufficiently distinct in terms of colour and brightness so that each object can be reliably detected, or under different light sources (i.e., UV light). The use of these resources should be considered to mitigate observer bias, however, they may not be readily available to all.
Size
Plastic size is an essential physical attribute for reporting, as it will dictate how plastic interacts with the environment and wildlife. The size of objects can be described in many ways, but for plastics size usually refers to the length of the longest axis (the maximum Feret diameter) and is grouped into different size ranges (Table 2). The simplest method is to categorise the plastic object using visual assessment against a scale bar. For larger objects (> 1mm) length can be measured more precisely using callipers, but this can be time-consuming for large quantities of plastics. If photographs or microscopy images with a known scale are available, automated image analysis software can be used to instantly and precisely measure multiple different size parameters for each detectable object in the image. When reporting size parameters, always specify which parameter was used (e.g. maximum Feret diameter, or major diameter from elliptical approximation) and present size distributions as well as category counts, where possible. It is essential to report the minimum size category in which the approaches used can accurately detect, in line with the size categories in Table 11.
Table 11. Size classifications used to categorise plastic, from macroplastics (> 2.5 cm) to microplastics (1 μm* - 5 mm), as well as nanoplastics (< 1μm), which require specialised procedures for detection.
| Plastic category | Size range |
|---|---|
| Macroplastics | >2.5 cm |
| Mesoplastics | 0.5 - 2.5 cm |
| Visible microplastics | 1 - 5 mm |
| Microscopic microplastics | 1 μm* - 1 mm |
| Nanoplastics (outside of the scope of this manual) | < 1 μm |
* Note: This field manual only focuses on microplastics > 20 µm.
Type
Plastic type is potentially indicative of its original form and function (e.g., pellets used as raw material vs fibres from textiles), though many microplastics are highly fragmented, degraded and show little physical resemblance to the original object. Defining the plastic type is dictated by the apparent shape, morphology and texture, assessed visually, as well as tactility (Table 12). Microplastics should be categorised to one of the most common overarching plastic types, and if more details of source are evident (e.g., artificial turf) this should be reported additionally. If photographs/images are available, automated image analysis software can provide some indication by measuring various shape parameters (e.g., regular, irregular, round) of each object (Valente et al., 2023), however, this approach is generally limited to differentiating pellets (small, round) from fragments (small, angular) from fibres (long, thin). The specific type parameters and the thresholds for differentiating each type must be reported.
Table 12. Classification of various plastic types observed in environmental samples. Types include fibres, fragments, films, beads, and others, providing insights into the diverse forms of plastic pollution. Photo credit: Thomas Crutchett.
| Type | Description | Photo example |
|---|---|---|
| Pellets | Small, plastic particles, from raw materials in industrial plastic production (plastic feedstock). Normally bigger in size (e.g., nurdles) but also includes microbeads and powder. Scale is 1 mm. | 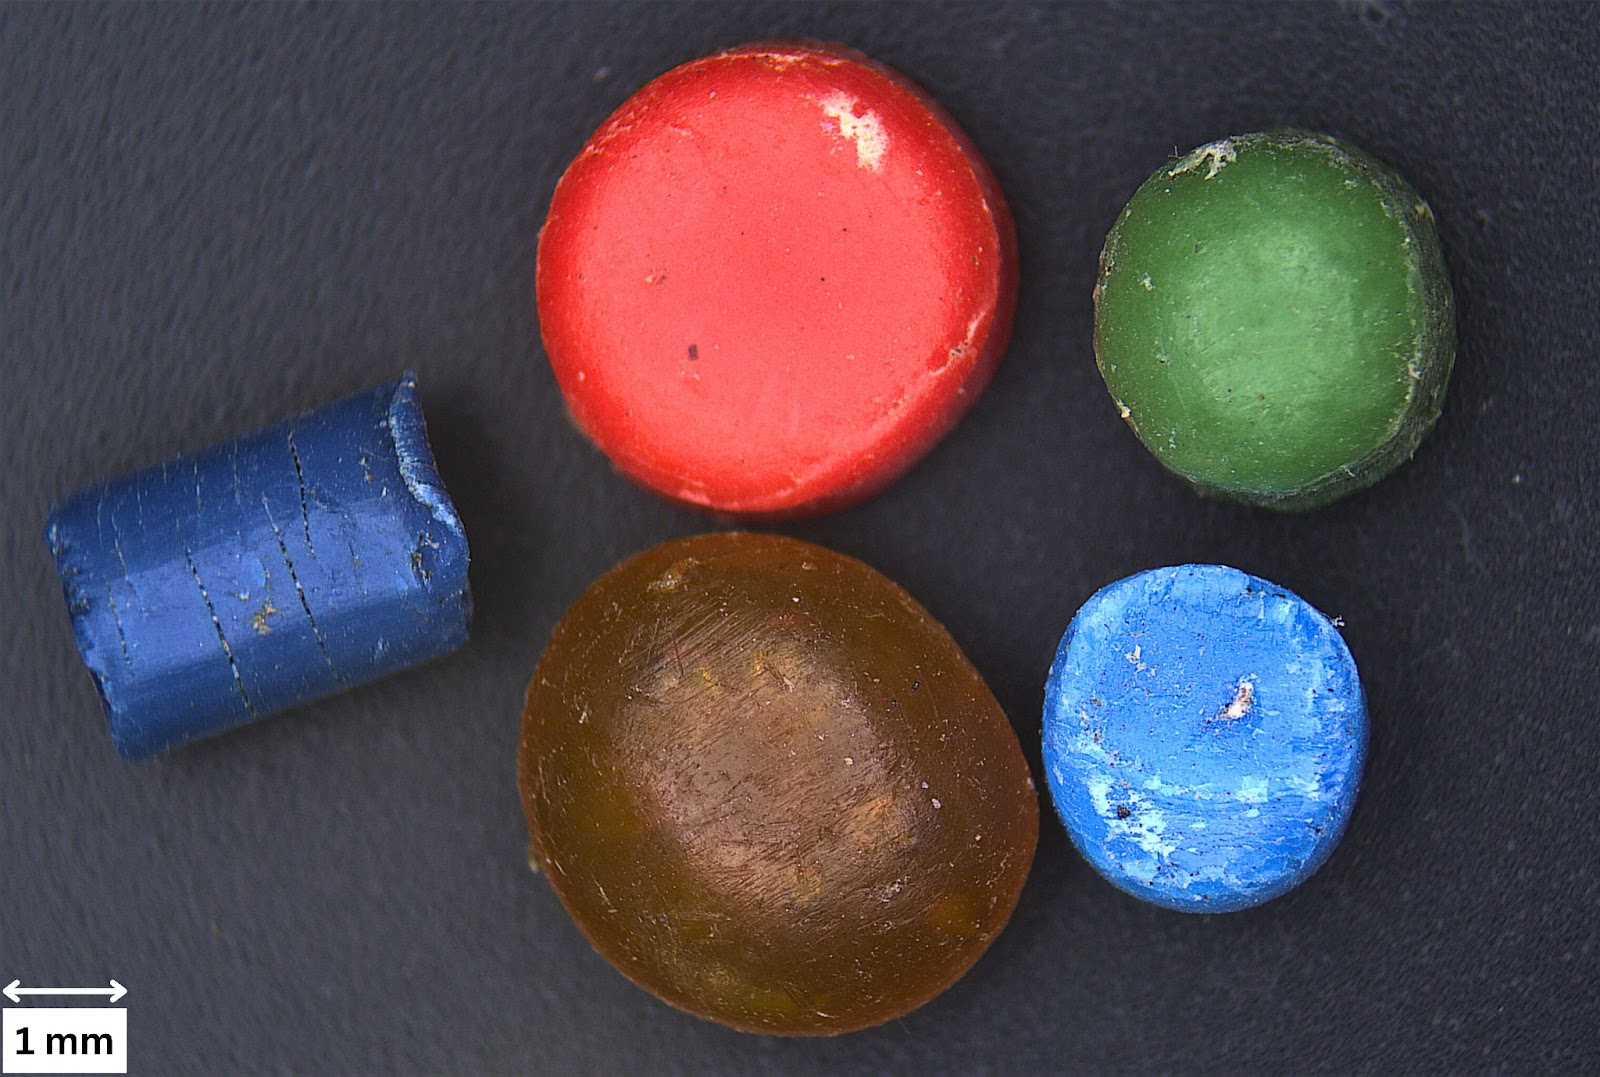 |
| Fragments | Originate from the breakdown of larger hard plastic objects, like bottles or containers. These fragments can take various shapes and sizes, be hard or soft, often with irregular edges. An example of an irregular shaped fragment can be tyre wear fragments. | 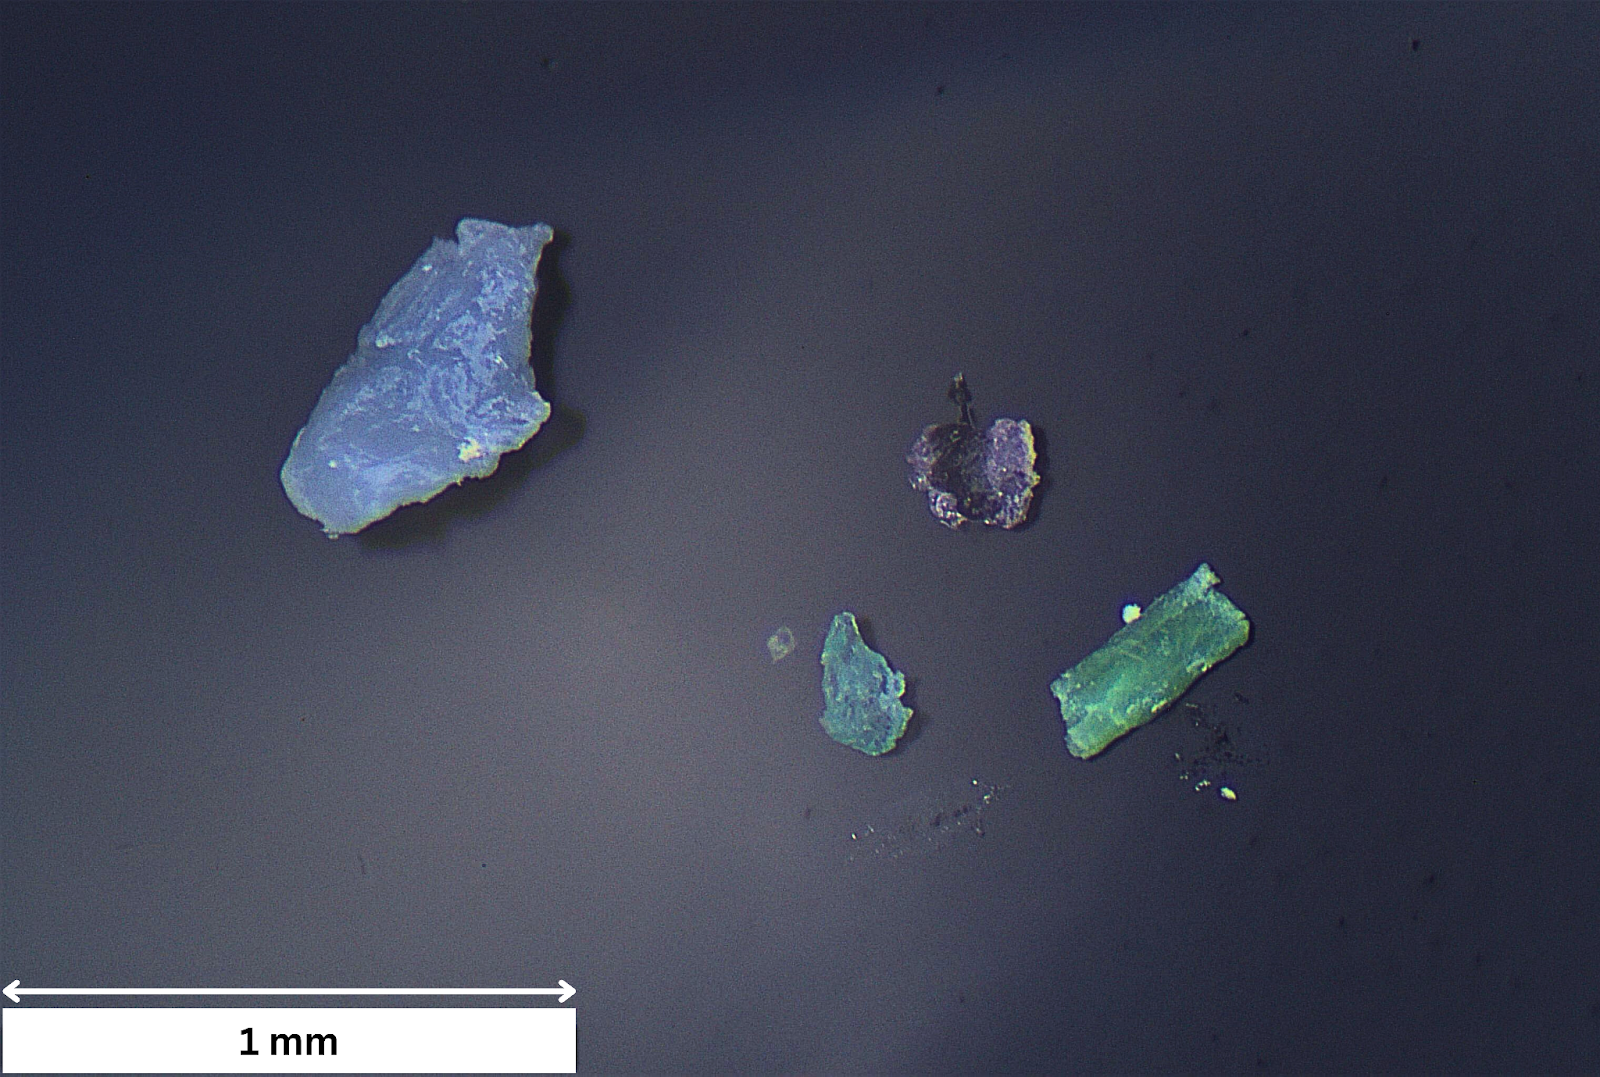 |
| Filaments | Strands of synthetic materials. These are often shed from clothing, textiles, and fabrics during washing and wear (fibres) or strands of fishing line which may be in monofilament or braided forms (line). Filaments can generally bend and are of uniform thickness across their length. | 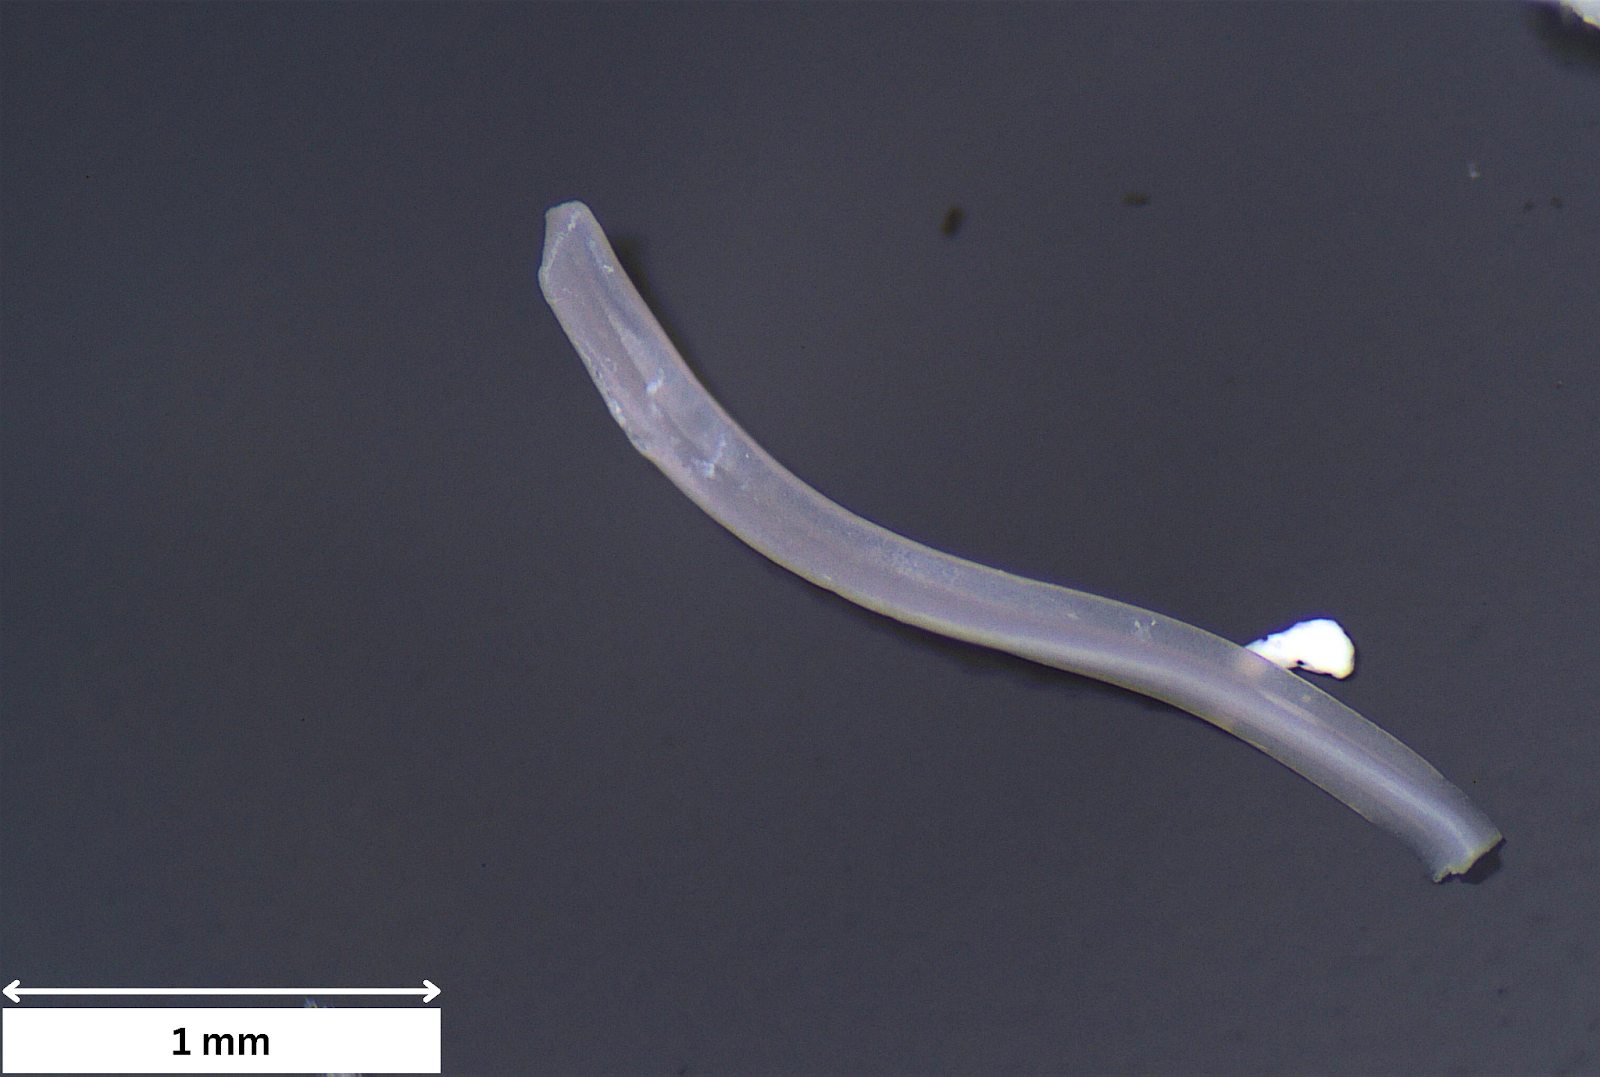 |
| Foams | Expanded plastic foam materials, like foam cups, packaging and insulation. These particles are lightweight and will compress if squeezed. | 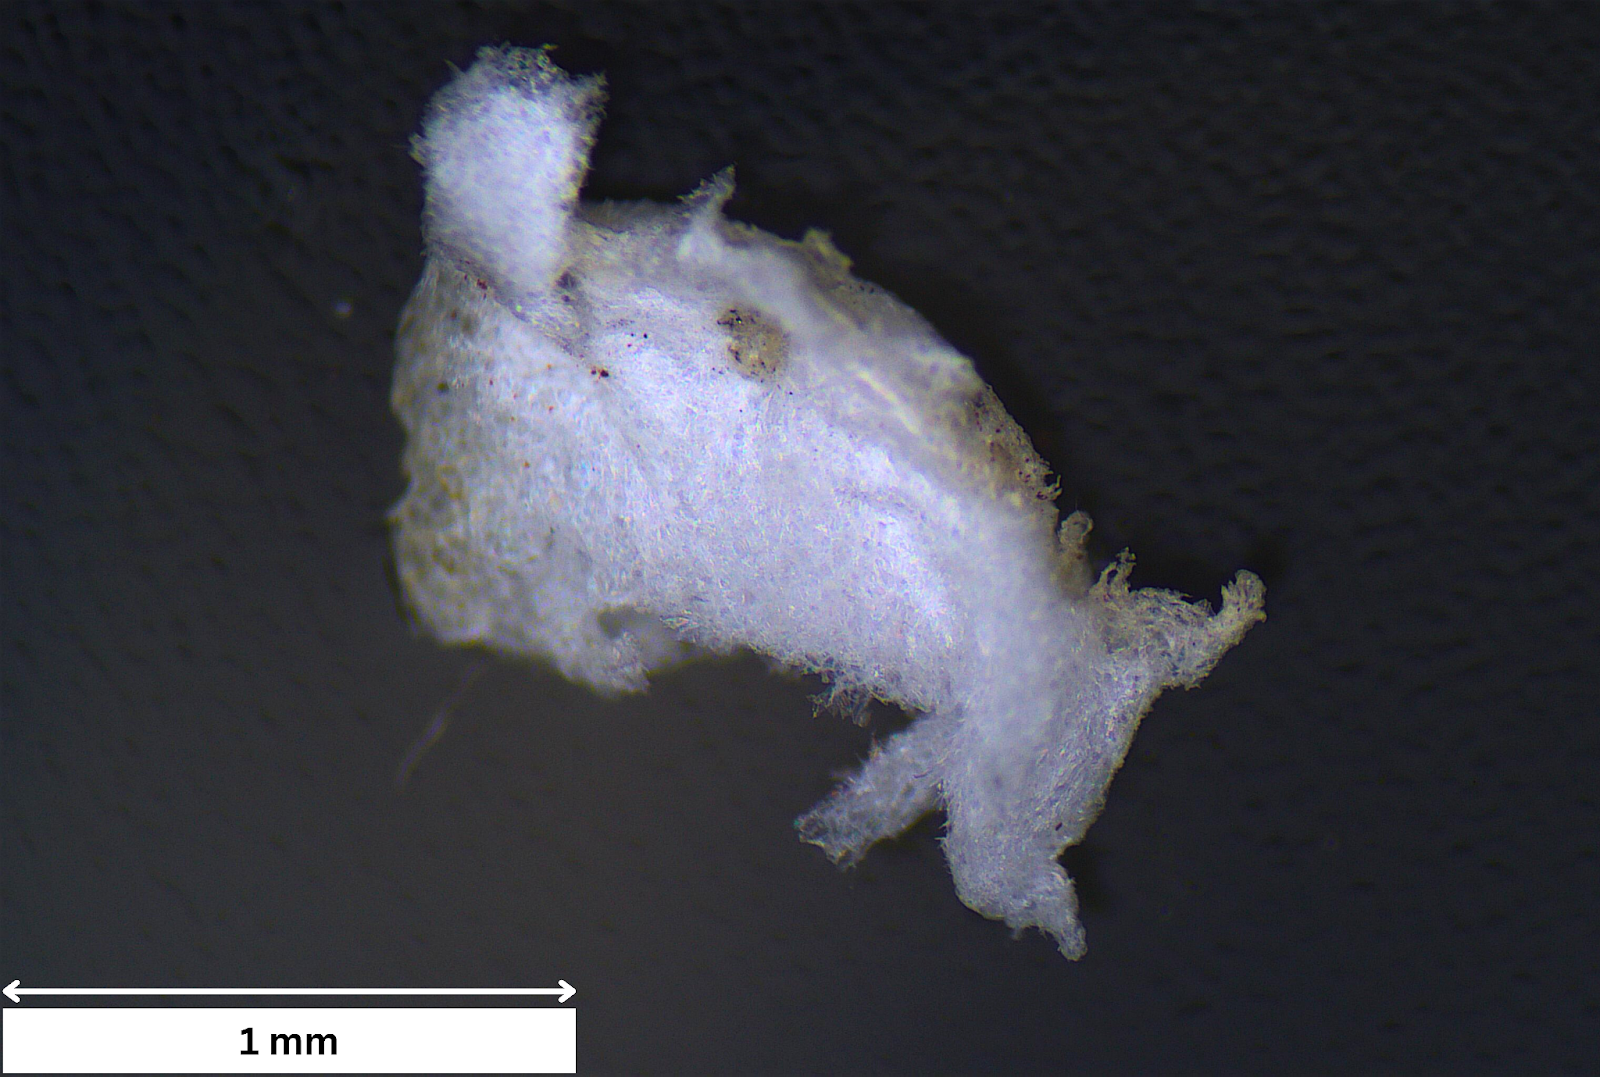 |
| Films | Originate from larger soft plastic materials, such as plastic bags and packaging. They are typically thin (and often transparent) and flexible, resembling miniature sheets or layers of plastic. | 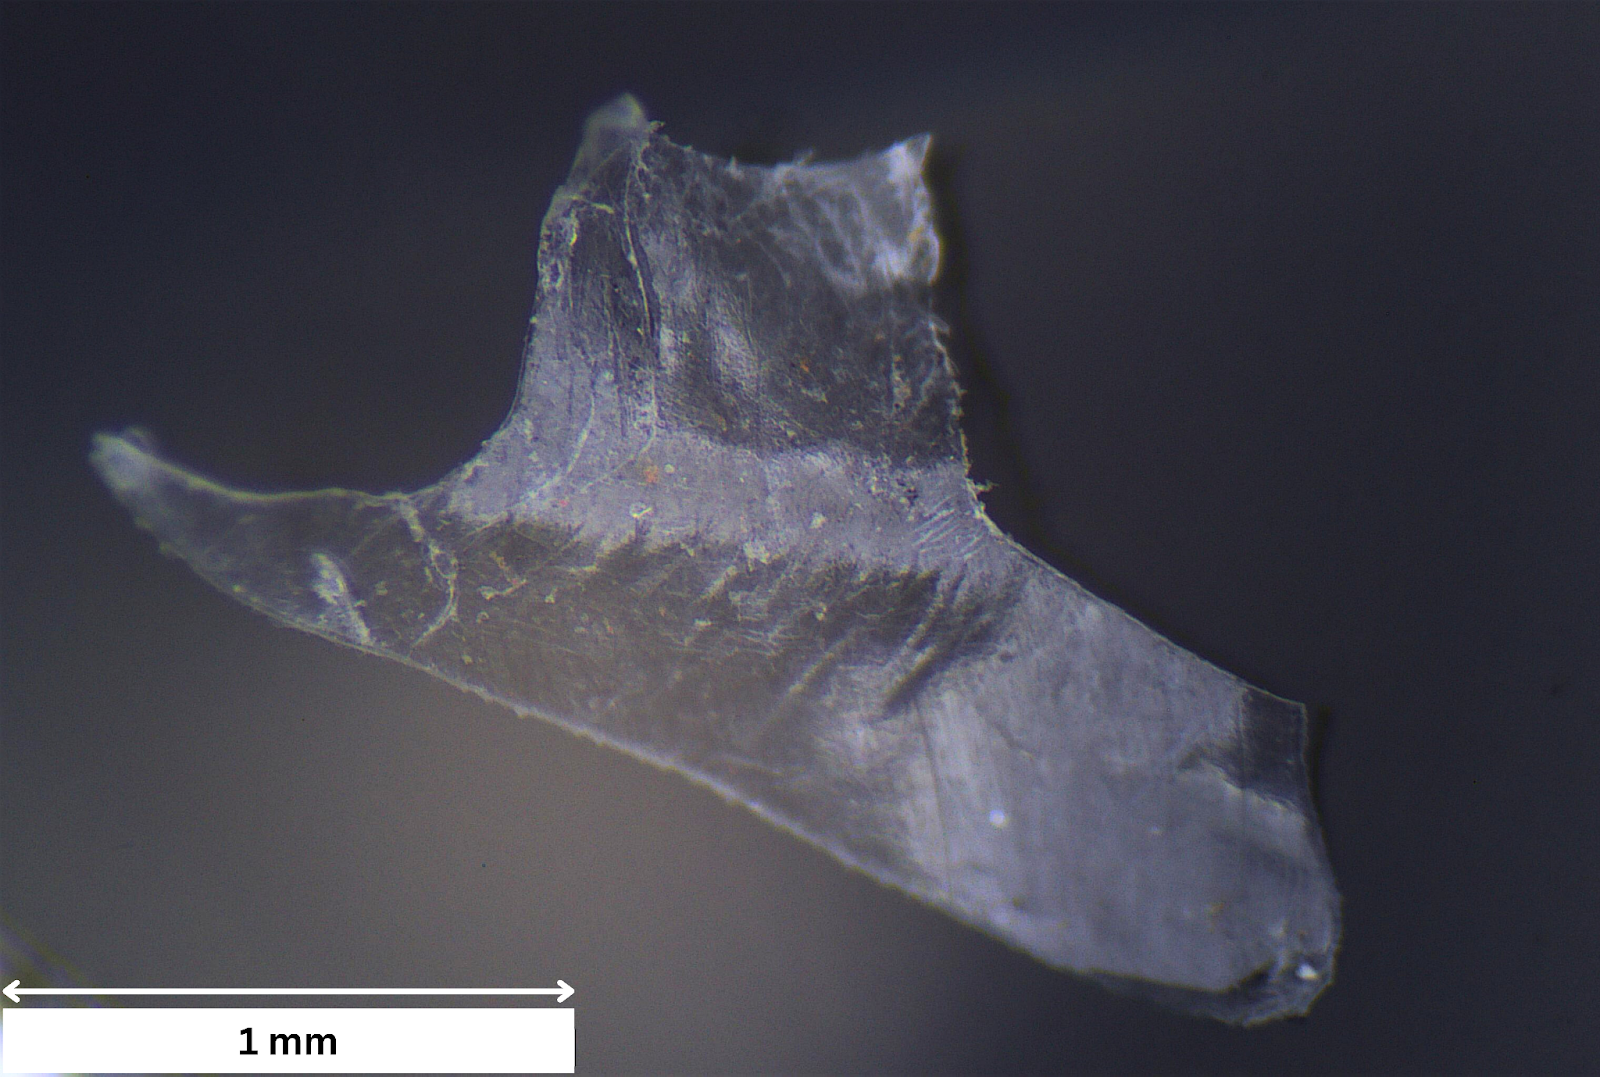 |
Colour
The colour of microplastics may be indicative of the original object or the extent of weathering or contamination (e.g., absorption of contaminants and biofilm), and may also influence the likelihood of ingestion by wildlife. Colour has conventionally been reported by assigning each plastic to a colour category based on visual assessment, but human judgment of colour is extremely subjective and the list of colour categories used is far from consistent between different studies. Recent efforts to standardise the reporting of plastic colour recommend using the following six categories: white, yellow, red, green, blue, and black (Provencher et al., 2017), or by comparison to 120 standard Pantone colours (Martí et al., 2020). These standard categories are inherently imprecise and can still be inconsistently applied by different human observers. If photographs/images are available, the average colour of a plastic object should instead be measured in terms of red, green, and blue (RGB) values or hue, saturation value (HSV) as acquired by the camera. RGB values are more precise and less subjective than colour categories and provide semi-continuous data (e.g. suitable for studying trends such as discolouration), but care must be taken to ensure the images are taken under consistent white lighting to correctly reproduce true colours. For larger (>1 mm) plastics that can be imaged using conventional photography, a photographic colour reference card imaged alongside the plastics can provide a point of calibration ensuring greater consistency in colour reproduction. If a colour reference card cannot be included, it is essential to report the lighting used (source, colour, temperature, etc.). It is important to note that for transparent and semi-transparent plastics, apparent colour may also be affected by the colour of the background.
Chemical characterisation
Due to challenges in identifying some microplastics using visual methods, especially small and/or transparent items, chemical analysis should be used to validate the identification of plastic, and confirm polymer composition and the anthropogenic nature of the particles. Importantly, polymer identification can also help identify the potential sources of microplastic, which in turn can influence regulation and policy. To confirm and validate that all retrieved particles were plastics, the preference should be that 100% of items are assessed. In instances where the number of putative microplastics is high and resources are not commensurate, then subsampling should match the resources available. If subsampling does occur, it is essential that the percentage of microplastics tested is reported, as well as the method used to select this subset and how representative this may be of the entire sample. This is an essential step to validating that the retrieved putative microplastics are indeed plastic, particularly for smaller microplastics.
There are several spectroscopy and spectrometry options for the chemical identification of plastics, with the method employed often dependent on the available equipment and the research question (Table 13). Although any chemical information about the microplastic is useful, Fourier-Transform Infrared Spectroscopy (FTIR) and Raman spectroscopic techniques are routinely used.
The chemical identification of microplastics involve comparisons of measured spectroscopic/spectrometric data compared to reference libraries of known materials. Reference libraries are usually a built-in functionality of commercial software used to operate the equipment, but the selection and breadth of available libraries vary between manufacturers and equipment. Furthermore, identification of plastics by spectroscopic FTIR and Raman methods can be complicated by chemical weathering, which alters the signature of the base material, and by biological and chemical contamination, which may introduce substantial secondary peaks in FTIR measurements and background fluorescence in Raman measurements (Fernández-González et al., 2021; Phan et al., 2022). Because library matching is a mathematical comparison, it may be misled by the appearance of altered or additional peaks, or by changes in background. To avoid erroneous assignments of weathered/degraded/contaminated plastics to inappropriate materials, matches should be assessed by an expert. Always consider whether the closest matching material spectrum is appropriate given the observed peaks, as well as the type, colour, and texture of the sample.
Table 13. Summary table of polymer identification instrumentation and their advantages, limitations, and minimum size that can be sampled.
| Machine | Size limit | Advantages | Limitations |
|---|---|---|---|
| μ-FTIR | 20 μm | - Sample retained - Broadly applicable to a range of samples - Commercial and open-source libraries of polymer spectra available |
- Time intensive |
| ATR-FTIR | 20 μm | - Sample retained - Broadly applicable to a range of samples - Commercial libraries of polymer spectra available |
- Time intensive - Soft/brittle samples may be damaged - Can only be done efficiently for larger microplastics (> 500 um) |
| Raman | 1 μm | - No contact and sample retained - Broadly applicable to a range of samples |
- Background fluorescence from plastic additives and/or contaminants can increase identification complexity - Time intensive |
| Pyr-GC/MS | Independent of particle size | - Broadly applicable to a range of samples - Suitable for simultaneous identification and mass quantification of plastics - Reduces sample treatment |
- Polymer types and abundance cannot be associated with particle size, type, shape, color, or numbers - Costly |
| LDIR | 20 μm | - Non-destructive - Quicker analysis |
- Costly |